
The man who invented the swing-o-meter
PLUS My election night drinking game

David Butler’s desk, Cambridge
Thursday, 10 March 1955
‘Cleggy boy, are you in town? Are you around bwoy?’ Jeremy Vine is dressed as a cowboy, in jeans, stetson and clutching a gun. He is talking to a computer-generated Nick Clegg, whose commitment to the saloon bar theme extends to a cowhide waistcoat and leather chaps. ‘Your leathers might not fit,’ Vine says. ‘But at least you’ve got ’em on.’ Bizarrely, this tableau, along with taking pot shots at tin cans apparently containing ‘Lib Dem Lurve Juice’, was designed to explain the vote share Clegg’s party had secured in previous elections, and how that might affect the 2008 local election results. Yes, this wasn’t even for a general election. This was for 137 district and unitary councils in England and all the councils in Wales.
Whatever David Butler had imagined more than half a century earlier, we can be pretty sure that it was not this. He had something much simpler in mind to explain politics: a pendulum to show the movement in support from one party to another. Doodling at his desk, the swing-o-meter was born. Butler, it is worth stressing, was a nerd. Initially a cricketing nerd, at the outbreak of the Second World War the cancellation of county matches deprived him of new data.
So, aged 21, he started crunching the numbers on elections instead. His work on the Cube Rule – which showed that if the ratio of votes between two parties in an election is A:B, then the ratio of seats they will win is A³:B³ – led to a 1950 article for The Economist, and even an invitation to brief Winston Churchill on his ideas. (When Churchill, then 75, asked if he was holding his party back, Butler replied, boldly: ‘You are not the asset you once were, sir.’) Butler shaped and crafted much of what we now consider to be the game of modern politics – he popularised and spread the use of the term ‘psephology’ to describe the study of elections. For more than half a century he wrote the Nuffield election studies, definitive academic accounts of the campaign and results. He appeared on the BBC’s first televised election programme in 1950, at a time when only 2 per cent of the country even had a TV set.
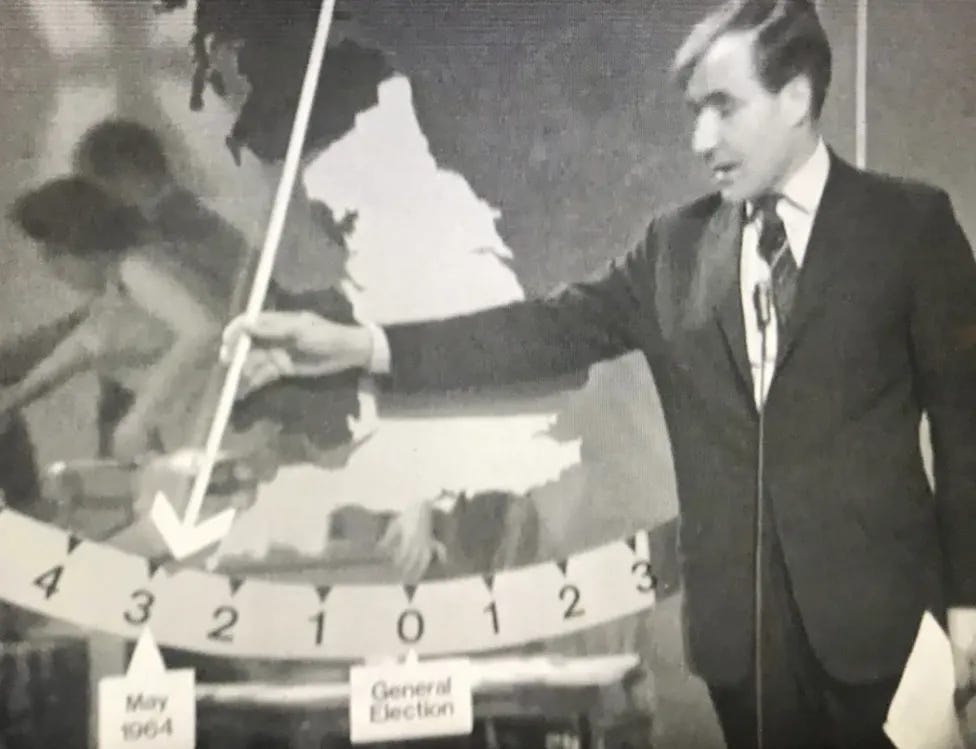
And he pioneered swing: the idea that from one set of results from a constituency or two it was possible to forecast, with some accuracy, the overall general election outcome. So if, say, Labour were up 5 per cent in one result, it was possible to work out how many other seats required a swing of 5 per cent or less for Labour to take them. In early 1955 there was a lot of talk in the BBC about using computing machines to do the number-crunching (and make the broadcast seem more cutting-edge). But it was a lower-tech solution that would change politics forever. In later life Butler would claim that others had created the swing-o-meter, which he then popularised. But his biographer, Michael Crick, unearthed letters which prove otherwise.
At home in Cambridge on Thursday, 10 March 1955 Butler sketched out a design for what would become one of the most iconic, and simplest, explainers of the complicated business of elections. In a letter to Grace Wyndham Goldie, a senior BBC producer of election and political coverage, Butler wrote: ‘To show people how the tide is going, a simple pendulum might be used. If the pointer is kept at the figure revealed by the electronic calculators as the average swing so far, the total number of seats likely to change will always be available.’ He enclosed a pencil drawing of what the pendulum might look like. A couple of months later he wrote again to Goldie, this time calling it a ‘speedometer type device’.
In the end the swing-o-meter only made a brief appearance in the coverage of the snap 1955 election, called by Conservative Anthony Eden to gain his own mandate after replacing Churchill as PM. By the 1959 election, though, it was a nine-foot contraption, operated on the night by Butler himself – the only time the inventor would appear with his invention. A young David Dimbleby watched as his father and broadcasting legend Richard grappled with Butler’s cutting-edge analysis. ‘It was a kind of magic because nobody knew what he was talking about, or how he had discovered this,’ says Dimbleby. ‘So he was like a sort of magician from the beginning.’
Butler’s friend and colleague Bob McKenzie would control the swing-o-meter for six elections from 1964, before the pendulum was passed first to Peter Snow, who swung a heavy metal pointer over an electronic screen which changed colour, and later Vine, whose graphics became increasingly ambitious (and baffling). It didn’t always work. In the Dudley West by-election in 1994, the swing from John Major’s Tories to Tony Blair’s ascendent New Labour was 29 per cent, which Snow’s machine could not compute. ‘It was too much for it,’ Snow recalls. ‘The whole screen went sort of blank.’ It happened again two decades later in Scotland after the 2015 general election, when a 30 per cent swing to the SNP was too much for the graphics. In fact, Scottish politics helped break the idea of a universal swing across the whole of the UK. In recent years broadcasters have experimented with two, three, even four different swing-o-meters, either to show the regional differences or the interplay between different party combinations. Something in its original simplicity, though, was lost.
‘We had enormous fun with the graphics,’ says Snow. ‘I don’t think David Butler was that keen.’ On the night of the 2015 election – in which Vine jumped around a virtual Commons chamber and recreated the Lib Dems as a collapsing house of cards – Butler appeared briefly with them on screen. ‘I think sometimes we get over-enthused with the graphics,’ he said with characteristic understatement.
Vine remembers it well: ‘He tried to disguise his feeling of being, I think, quite appalled by the whole snazzery of the graphics. Every time we do a general election now I say, look, let’s have the bloody thing made of wood again, as a tribute to David, because in the end that’s the joy of it, let’s keep it as simple as we can, a piece of wood on a nail.’
This is a chapter taken from my book, Planes, Trains and Toilet Doors: 50 Places That Changed British Politics. It is out now in hardback, and out in the autumn in paperback.
What are you doing tonight?

I am so excited. I have covered five elections now in varying ways for newspapers and websites. But to be live on air on the radio when it all happens is a new level of political excitement/nerdery.
I have a ring binder of stats and briefing notes. I suspect it will last me about an hour before the live news takes over. As I wrote for The Times (in perhaps the final piece to get me on the front page):
Too many people have complained this election has been boring, predictable, too long. And by people, I mean political journalists who don’t realise how lucky they are to have a front row seat on history being made.
And just because we think we know the shape of that history, doesn’t stop the 2024 election being historic. Either the Conservatives win a fifth election in a row, unprecedented in modern British politics. Or Labour stages an extraordinary comeback after their worst result for more than 80 years.
The outline of the outcome might be a foregone conclusion, but tonight it’s all in the details. Over several hours 650 individual tales will come together to write the next chapter in our national story. Oh and it will be funny. And tragic. And dramatic.
Anyway, I’ll be on Times Radio and our YouTube channel (so you can watch on your telly) from 9.55pm on Thursday until 10am on Friday, and then back again on Friday from 10am-1pm.
We’ve got a brilliant line-up of politicians, journalists, experts and analysts. And a brass band, kicking off with a rendition of All Night Long before the exit poll drops at 10pm. And Heidi, a listener who is going to knit the results as they come in. Knitting on the radio. I can’t wait.
My election night drinking game
Whatever happens tonight will be well worth having a drink for. Unless you happen to be presenting eight hours of live radio, obviously. Apparently I’m not allowed to bring vodka jellies in party colours into the Times Radio studio. Probably for the best — I don’t want to stain my silver velvet jacket.
Anyway, in what is probably my last piece for Times 2 before I leave, I have compiled a drinking game which should get you through the night, which includes a guide to Potential Portillo Moments.
There are lots of big names in play: Chancellor Jeremy Hunt, a man who always looks like he is about to burst into tears, could be moved to do it for real at 3.30am. Around the same time Grant Shapps, the defence secretary, might be beating a retreat in Welwyn Hatfield while HMS Penny Mordaunt could be sunk in Portsmouth. Home secretary James Cleverly could even be at risk, apparently, in Braintree (4am). Former Tory leader Iain Duncan Smith, the quiet man who turned up the volume, could find he is unplugged at 3am.
But the big one to keep an eye out for is the geographically-confused South West Norfolk, home to the economically-confused Liz Truss. In theory it’s a safe Tory seat and it’s not due to declare until around 5.30am, so only one for the truly committed. But wowsers, imagine that. A former Tory prime minister losing their seat. It happened in 1906 when Arthur Balfour was swept aside in the Liberal landslide. The Conservatives were reduced to a rump of just 156. Or what we now call “Rishi Sunak’s wildest dreams”. Go online now to search for “lettuce liqueurs”.
You and Producer Andrew (?) did a great job last night/this morning. I was listening during July 4 festivities Houston. Thrilled that you are on Substack. Keep posting! - John V (former CYGTN10 Home Secretary)